Being Patient At The Plate Doesn't Correlate With Scoring More Runs

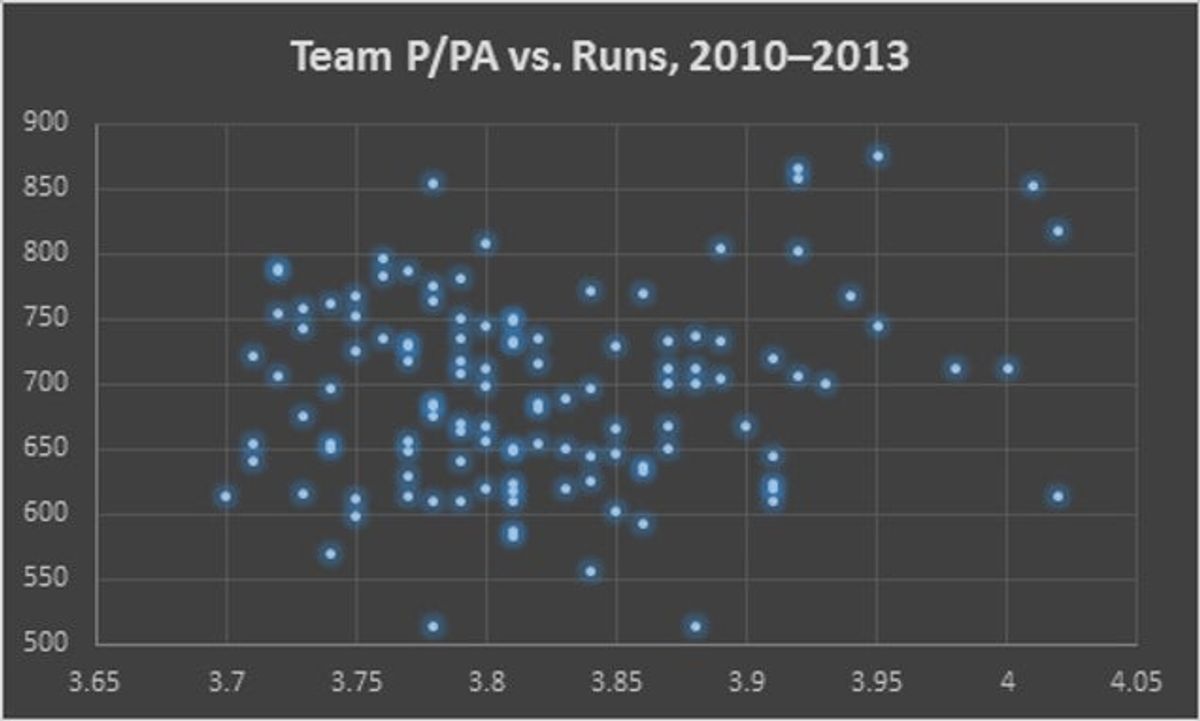
If you want a good baseball offense, you need to milk to pitch count. That's what it says in Moneyball, and it's been Red Sox gospel under Terry Francona. But as the graph above from shows, it isn't significantly related to offensive production.
From 2010 to 2013 teams who see more pitches per plate appearance have had both low offensive production (Red Sox, Mets, Phillies) and high production (Blue Jays, Athletics, Indians). Whether looking at runs scored or team offense (wRC+), correlations with plate patience were negligible.
This doesn't seem to be just some effect of the league catching up with the trend, either. We went back a bit further and looked at pitches per plate appearances in 1999. In 1999 batters saw a similar amount of pitches per plate appearance as they did in 2010 (3.73 in 1999, 3.82 in 2010). And like post-2010 trends, there was no significant correlation (0.19) in 1999 between pitches per plate appearance and runs scored.
The only significant relationship found in the article is that patient teams were more likely to garner another at bat when a starting pitcher is going through the lineup for the fourth time. But this resulting added at bat generally happens at the bottom of the lineup, which reduces its impact.


- MLB Predictions and Best Bets for Saturday's Biggest Games
- UFC Vegas 118 Betting Picks: Three Fights to Target on Saturday Night
- MLB Picks Today: Two Pitchers Set Up To Fall Short On Outs Props
- MLB Pitcher Props Today: Best Bets for June 3rd
- NBA Finals Game 1 Best Bets: Knicks vs. Spurs Predictions and Player Props
- Stanley Cup Final Game 1 Best Bets: Hurricanes vs. Golden Knights Picks
- Knicks vs. Spurs Game 1 Props: Three Best Bets for the NBA Finals